Sea-Bird CTD for ALACE Floats
Yields Accurate and Stable Salinity
![]()
18-Degree Water study at the University of Washington
This project, sponsored by the US National Science Foundation, is designed to examine the formation and circulation of the so-called "18-degree water" of the North Atlantic, using the technique of profiling ALACE (PALACE) drifters. In all, approximately 75 PALACEs will be deployed as part of this project.
The first PALACEs were launched in July and August of 1997 from the R/V Knorr. Beginning in November of 1997, most drifters were deployed from Voluntary Observing Ships (VOS). Between November 1997 and March 1998, 43 VOS deployments of PALACE drifters were successfully executed.
The R1 PALACEThe R1 model of PALACE has reached a mature phase of the development cycle and has proven its reliability. The reliability of the drifters can be measured in terms of the number of profiles expected during a specified time period as compared to the number actually executed as illustrated in the following table (updated daily).
| Profiler Reliability Statistics | ||||
| Period from Jul 01 12:01 GMT 1997 to Nov 06 12:27 GMT 1998 | ||||
| Group | Size | Profiles Executed | Profiles Expected | Reliability (%) |
| R1 | 63 | 1902 | 1994 | 95.4 |
The R1 model of PALACE is manufactured by Webb Research Corporation (WRC).
The Sea-Bird CTD sensor module
While most of the R1 drifters measure only the temperature profile, three R1’s (063, 125, 126) were equipped with an integrated Sea-Bird CTD sensor module manufactured by Sea-Bird Electronics, Inc (SBE). These three instruments were intended as a field test of the ability to measure salinity over a long period of unattended operation.
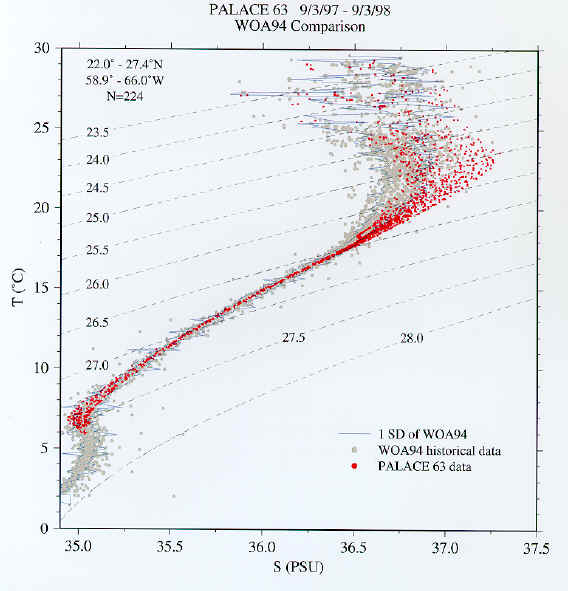
PALACE 063 was the first to be equipped with the Sea-Bird CTD module and was deployed on August 24, 1997. The T-S curves for the first year’s (36) profiles (red symbols) are illustrated in the plot below along with 224 historical profiles (gray symbols) that were collected from the same geographical region. The blue curve represents one standard deviation of the historical data on either side of the mean. The historical data were real observations included in NOAA’s World Ocean Atlas’94 (WOA94). The CTD data were taken exactly as reported by the CTD module - no editing was performed.
Noting the segment in the plot where the T-S relation is particularly well defined, no salinity drift is detectable for PALACE 063 after more than one full year of operation.
Float 126 has similar results after being
deployed for about eight months.
This excerpt is from the website of Dr. Steve Riser of the University of
Washington in Seattle:
http://flux.ocean.washington.edu/atlantic/info/sbe41.html
![]()
Sea-Bird Home Phone: (+1) 425-643-9866 E-mail: seabird@seabird.com