APPLICATION NOTE NO. 64-2
SBE 43 Dissolved Oxygen Sensor
Calibration and Data Corrections
Revised June 2012
![]()
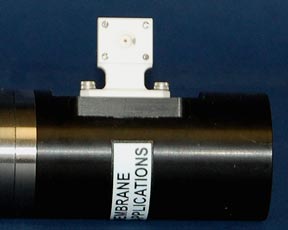
Figure 1. SBE 43 |
This application note contains a short summary of recommended sensor maintenance and validation procedures, motivated by sensor-implementation experiences of customers as well as Sea-Bird. It describes methodologies for extending factory service intervals for the SBE 43, as well as methods for correcting real-time sensor outputs or post-correcting dissolved oxygen data from both moored and profiling CTD applications. Routine validations keep sensors operating in the field longer, extending deployment periods, reducing the frequency of site visits, and decreasing overall maintenance costs when fouling is not irreparably impairing sensor performance. Experienced field scientists and instrument technicians are aware that waterborne pollutants and bio-fouling are expected when working in any natural marine and freshwater environment. Therefore, drift thresholds for sensor performance should be established prior to data collection, to determine how often instruments should be serviced, validated, and returned to Sea-Bird for a full service and calibration. |
 |
What Causes SBE 43 Sensor Drift?
Changes in sensor electronics and fouling (biological growth on a sensor, or coatings from oil and other materials in the water column) are the main causes of temporal loss of accuracy in aquatic sensors. The SBE 43 DO sensor has very stable electronics; therefore, any loss of accuracy is primarily due to fouling. Often, simply rinsing off the sensor with a soapy non-ionic solution (i.e. diluted Triton-X) restores the sensor’s performance.
In moored applications, using the SBE 43 DO sensor as part of a CTD system that is designed to counteract bio-fouling is critical for extending measurements.
Storing the cleaned SBE 43 sensor as directed, in
a looped Tygon tubing with a moist sponge for example, will help prevent in situ
fouling between sampling deployments. Storing in water is not advised.
Note: For cleaning and storage details, see
Application
Note 64: Background
Information, Deployment Recommendations, and Cleaning and Storage.
SBE 43 Calibration Equation and the Effect of Fouling
The equation below, used in Sea-Bird’s software for calculating dissolved oxygen in ml/L from SBE 43 output voltage, is a form of that given in Owens-Millard (1985):
Oxygen (ml/L) = [Soc * (V + Voffset + tau(T,P) * dV/dt)} * Oxsol (T,S) * (1.0 + A*T + B*T2 + C*T3) * e (E*P/K) Eqn 1
Where:
The SBE 43 output is linear with respect to oxygen concentration, and maintains a relatively stable output at zero oxygen (the electronic Voffset term in equation 1). Electrochemical drift, a limitation in previous Clark designs, exists somewhere below the calibration uncertainty of 1 µmol/kg for the SBE 43, and has not been observed in several years of factory calibration data nor in long-deployments on Argo floats and moorings. Therefore, any sensor drift with time is primarily attributed to fouling of the membrane, either biological or waterborne contaminants (i.e., oil).
Adverse fouling might take several weeks to months to occur. Fouling of the membrane eventually causes the sensor to read low of correct. When the SBE 43 sensor starts to show drift from fouling, the effect on the sensor calibration is linear, and therefore can be corrected by adjusting the linear slope term of the calibration equation (Soc term in equation 1).
If the reference method for making the correction is as accurate (i.e., competent Winklers or another clean/calibrated DO sensor from another instrument), the sensor can continue to report DO concentrations within factory specifications by applying an adjustment to Soc. This is particularly useful for long-term deployments, when real-time data accuracy matters.
Routine sensor checks can be done in the field
while the instrument remains on the mooring, or in the lab before and after
deployment / recovery. A qualified reference standard, such as a Winkler water
sample or clean, calibrated SBE 43 reference sensor, is needed for in-field
validation. This provides a defensible way to adjust the Soc term in the
calibration equation and the configuration file used to compute oxygen
concentration in Sea-Bird software (Seasave real-time data acquisition and SBE
Data Processing post-processing software). A similar approach can be used in the
lab with a bath and reference sensor or with carefully drawn Winkler water
samples.
Note: The configuration (.con or .xmlcon) file supplies calibration
coefficients to Sea-Bird software for converting raw data to engineering units
(i.e., for the SBE 43, the calibration coefficients allow the software to
convert voltages to ml/L).
Note that the SBE 43 drifts in slope, not offset. This means that applying a simple offset to DO data in a given range of values (e.g., 5-6 ml/L) will give incorrect results in a different range (e.g., 4-5 ml/L).
Follow these simple steps to derive a correction factor to adjust Soc (or a series of factors if multiple validation points for a given sensor are available; see Irish et al., 2008):
A Few Pointers Regarding Validation Techniques
Comparing Sensor Measured Percent Saturation to Theoretical Oxygen Saturation as Validation
Comparing theoretical saturation values based on the 100% oxygen saturation capacity of the water at a given temperature and salinity to the actual measured percent saturation from the SBE 43 sensor is another way to examine sensor performance and water quality trends in time. These comparisons are best made near the surface, where oxygen saturation in the water column is typically near 100%.
Note that the measured oxygen concentration can be lower or higher than theoretical saturation due to natural causes:
Trends may differ between the measured and theoretical percent saturation, largely due to non-conservative behavior of dissolved oxygen in natural waters from biological photosynthesis and respiration and also organic matter chemistry. If the saturation measured by the sensor does not match the theoretical saturation based on temperature and salinity alone, this does not mean the sensor is reporting incorrectly.
The main term of interest for correcting fouling drift is the Soc term in the SBE 43 sensor calibration equation:
Oxygen (ml/L) = Soc * (V + Voffset) * φ Eqn 2
where:
Note: Earlier versions of this application note described a method for deriving a slope (Soc) and Voffset correction. However, most data collection efforts are not accurate enough and do not collect enough water samples over a full scale range of values to make Voffset corrections that are accurate enough for the reporting specification of the sensor. Therefore, we no longer recommend that older approach.
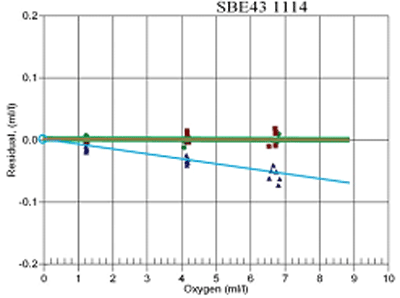
The loss of sensitivity attributed to sensor membrane fouling is observed as a linear change in sensor output when compared to a set of reference samples (Figure 2 and Table 1). The ratio of the reference sample values to SBE 43 measured DO concentrations remains constant over the sensor range (for multiple values of DO as shown in Table 1). This allows for adjustment in the slope term Soc using just one quality reference sample, because any of the reference values provide the same correction in an otherwise healthy sensor.Figure 2. SBE 43 sensor SN 1114 original factory calibration (green dots); post-recovery calibration prior to sensor cleaning (blue triangles); re-calibration after sensor cleaning (red squares). Note the loss of sensitivity in the post-recovery calibration (blue triangles) is strictly linear, and that cleaning restored the SBE 43 to its pre-deployment calibration accuracy (red squares).

Table 1. Reference Winkler water samples and sensor readings at 3 DO concentrations during post-recovery calibration of SBE 43 sensor SN 1114 (Figure 2). The ratio of the Winkler values to the corresponding SBE 43 outputs can be used to calculate the Soc correction factor. Note the correction factor remains constant at each validation point over the range of values shown, illustrating that any single validation point alone could be used to correct the slope. Also illustrated is that the difference between the SBE 43 and reference Winkler is not constant.
| Winkler DO of Bath, ml/L | SBE 43 Output, ml/L | Residual (SBE 43 – Winkler) | Correction factor (Winkler/SBE 43) |
| 6.80 | 6.75 | -0.05 | 6.80 / 6.75 = 1.007 |
| 4.20 | 4.17 | -0.03 | 4.20 / 4.17 = 1.007 |
| 1.20 | 1.19 | -0.01 | 1.20 / 1.19 =1.007 |
Simply multiplying the pre-deployment Soc value by the correction factor, given by the ratio
(Winkler DO Value / SBE 43 DO Value)
provides a correction to the linear slope term (Soc) in the calibration equation and offers a powerful and scientifically defensible way to make residual corrections to data from unattended, long-term deployments.
Example of In Situ Data Correction for Continuous Real-Time Mooring Data Applications
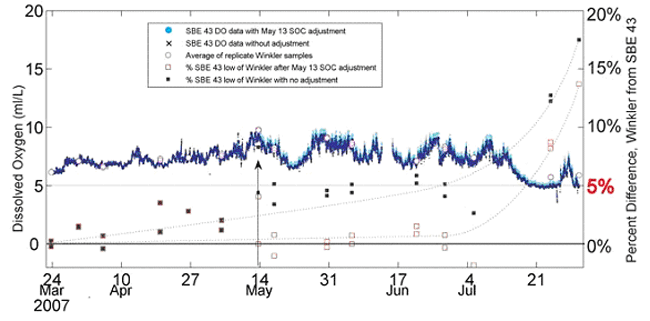
In this example, we use data collected with an SBE 43 DO sensor deployed in an urban marina for 4 months during the biologically active spring and summer seasons. The integrated SBE 43 and CTD (conductivity, temperature, and depth sensor) was moored at 2 meters water depth and sampled every 10 minutes following a 30-second flush cycle. Replicate Winkler samples were collected bi-weekly from a 1.2-liter Niskin bottle adjacent to the moored SBE 43 sensor, at the time of a sample. The SBE 43 measured dissolved oxygen within 5% of Winkler reference values for over 107 days (~3 months) during high biological fouling conditions (Figure 3).
Figure 3. SBE 43 dissolved oxygen time series in dark blue, March 23 – July 31, 2007. Data with a slope adjustment made after May 13 are co-plotted in cyan. Average Winkler values are open pink circles, and the percent difference between the SBE 43 and Winkler averages are co-plotted along the right y-axis as black solid squares (before the May 13 validation and slope adjustment), and as red open squares (from May 13 forward following the adjustment). The dashed curved lines illustrate how correcting the in situ data can prolong deployment while maintaining accuracy in real-time (or post-processed) data. Mean standard deviation of the Winkler replicates is 0.03 ml/L.

A single validation point made on May 13 is used to demonstrate the correction of in situ sensor data without servicing or recovering the instrument (see arrow in Figure 3). The average of the replicate Winkler values on May 13 is 9.737 ml/L; the SBE 43 reported 9.308 ml/L. To adjust the calibration for data after May 13, a new Soc is obtained by multiplying the pre-May 13 Soc (1.3256e-04) by the ratio of the reference value to the sensor value. Verify the units of each are compatible (ml/L, mg/L, µmol/kg, or % saturation).
[(Winkler value ml/L) / (SBE 43 value ml/L)] => (9.737/9.308 = 1.046):
NewSoc = previousSoc * ([Winkler] / [SBE 43])
1.3866e-04 = 1.3256e-04 *1.046
The result of using NewSoc on data collected after May 13 (cyan blue line ml/L and open squares % difference) demonstrates how sensor accuracy is maintained near initial calibration accuracy by using a single quality reference sample. See the next example for a description of how to apply a correction to data preceding the May 13 reference sample (time rate of change in drift correction).
Note: We recommend that the sensor be returned to the factory for servicing when the NewSoc value represents a change of 15 - 20% from the original calibration and cannot be restored with standard cleaning protocols (see Application Note 64 for cleaning recommendations).
Example of Post-Processing Data Correction and Computing Time Rate of Change in Soc
Sometimes, in-field validation is not possible. This restricts correction of possibly fouled data to post-processing, and requires a reference validation sample be taken at the end of the deployment or soon after the instrument is recovered. The reference validation sample could be a water sample taken in the field prior to recovery or a factory post-calibration.
A simple method for data correction in post-processing is to assume a linear fouling adjustment per day (or week, or month) for the entire period or between field validation data collection periods. The resultant rate of change in the sensor measurement can then be programmed into a simple algorithm to calculate corrected DO data with time.
Post-Processing Correction Example 1:
The fouling drift in sensor data shown in Figure 3 is linear with time. To apply a correction, simply compute the rate of change per day in the Soc value from the beginning of the deployment to May 13, when an in situ reference sample was made (50 days).
Soc rate = (NewSoc – previousSoc) / # of days
0.0012e-04 per day = (1.3866e-04 – 1.3256e-04) / 50
Post-Processing Correction Example 2:
For this example, pre- and post-calibration data from sensor 1114 are used (Table 1). Sensor 1114 was deployed in a high-fouling coastal lagoon for 2 months with no interim servicing. After recovery, the sensor was returned to the factory for calibration and shown to have fouled ~1% (Table 1). The post-calibration Soc value prior to cleaning, and the rate of change in Soc, are computed as follows:
NewSoc = previousSoc * ([Winkler] / [SBE 43])
0.3837 = 0.3810 * 1.007Soc rate = (NewSoc – previousSoc) / # of days
4.445e-05 per day = (0.3837 – 0.3810) / 60
During the 2-month deployment period, the sensor experienced an Soc change rate of about 0.000045/day. In reality, a sensor may not exhibit fouling for several weeks to months (as shown here, fouling was minimal), so the user will need to decide how best to determine the time span and data correction criteria of fouled data. Interim water samples or reference checks (using a CTD) between service intervals can provide valuable information on fouling. Variations on the methods used for post-correcting data are also possible.
Data corrections are only as good as the reference samples used to correct the data. We therefore recommend replicate water sample collection, or validation methods that employ a sensor that is as accurate as the moored sensor being tested.
References
Owens, W. B., and R. C. Millard Jr., 1985, A new algorithm for CTD oxygen calibration. J. Physical Oceanography., 15, 621-631.
Garcia and Gordon (1992), Oxygen solubility in seawater: Better fitting equations, Limnology & Oceanography, vol 37(6), p1307-1312.
Irish, J.D., L.G. Ward, and S. Boduch, 2008, Correcting and validating moored oxygen time-series observations in the Gulf of Maine. MTS 1-410-884-5330, IEEE Catalog Number CFP08OCE-CDR, ISBN 978-1-4244-2620-1, Library of Congress 2008904879.
Janzen, C., N. Larson and D. Murphy, 2008, Accurate long-term O2 measurements using the SBE 43 in harsh bio-fouling environments. International Ocean Systems, Vol. 12, No. 2 March/April 2008, pp. 6-8.
Janzen, C.D., D. Murphy, and N. Larson, 2007, Getting more mileage out of dissolved oxygen. Proceedings of OCEANS 2007 MTS/IEEE Vancouver, B.C., Canada, 0-933957-35-1, 5p.
Janzen, C., and N. Larson, 2008, Assessing the Calibration Stability of Oxygen Sensor Data on Argo profiling floats using routine WOCE monitoring data from HOT, from poster presentation, 2008 Ocean Sciences Meeting, Orlando Florida.
Janzen, C., and D. Murphy, 2007, Extend Your Dissolved Oxygen Measurements in High Fouling Environments, poster for Estuarine Research Federation 2007 Conference, Providence, RI, USA.
Murphy, D., N. Larson, and B. Edwards, 2008, Improvements to the SBE 43 Oxygen Calibration Algorithm, poster presentation, 2008 Ocean Sciences Meeting, Orlando, Florida, USA.
Application Note 64: SBE 43 Dissolved Oxygen Sensor -- Background Information, Deployment Recommendations, and Cleaning and Storage
Application Note 64-1: Plumbing Installation -- SBE 43 DO Sensor and Pump on a CTD
Application Note 64-3: SBE 43 Dissolved Oxygen Sensor -- Hysteresis Corrections
| Date | Description |
| Initial release. | |
| October 2002 | Correct data in example for calculating phi and (Winkler O2 / phi). |
| August 2005 | Correct Data Conversion screen capture which shows offset and range; offset should be -5 instead of 5, to match the text description below it. |
| April 2008 | - Introduce Sea-Bird equation,
update equations, etc. - Add procedures for adjusting calibrations for long-term deployments. - Update photo for offset intake/exhaust on DO sensor. - Update Data Conversion screen capture to show Miscellaneous tab. - Add SBE 19plus V2. - Add SBE 55 ECO Water Sampler. |
| February 2010 | - Update photos to show SBE 43 with
black plastic parts instead of white plastic. - Add information on .xmlcon files. - Update address. |
| June 2012 | Rewrite to eliminate correction procedure that includes correcting Voffset. Most data collection efforts are not accurate enough and do not collect enough samples over full scale range of values to make Voffset corrections that are accurate enough for reporting specification of sensor. Therefore, we no longer recommend that older approach. |
![]()
Sea-Bird Home Phone: (+1) 425-643-9866 E-mail: seabird@seabird.com