APPLICATION NOTE NO. 64-2
SBE 43 Dissolved Oxygen Sensor
Calibration and Data Corrections using Winkler Titrations
Revised February 2010
![]()
Figure 1. SBE 43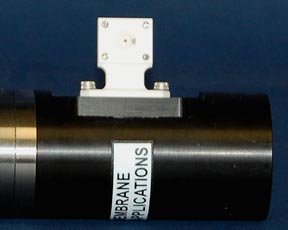 |
This application note describes methods for adjusting the calibration coefficients for the SBE 43 Dissolved Oxygen (DO) sensor, and for correcting long-term moored data either in real-time or during post-processing. The first method requires numerous Winkler titrated water samples and corresponding sensor voltages to compute new slope and offset terms for the sensor calibration. The second method is most applicable for long-term moored data applications that typically only have a few reference samples and are temporally affected by bio-fouling of the sensor membrane. |
 |
Calibration Adjustment Using Multiple WInkler Water Samples and Sensor Voltages over a Wide Range of Oxygen Calculations
This method statistically estimates calibration coefficients for calculating dissolved oxygen in milliliters per liter from SBE 43 output voltage. The technique requires dissolved oxygen concentrations reported in ml/l (determined from a range of Winkler titrated water samples) and SBE 43 oxygen voltage outputs measured at the times the water samples were collected. Sea-Bird’s data processing software, SBE Data Processing, is used to produce a data table suitable for the analysis.
Basic Principal
The equation below, used in Sea-Bird’s software for calculating dissolved oxygen in ml/l from SBE 43 output voltage, is a form of that given in Owens-Millard (1985):
Oxygen (ml/l) = [Soc * (V + Voffset + tau(T,P) * dV/dt)} * Oxsol (T,S) * (1.0 + A*T + B*T2 + C*T3) * e (E*P/K) Eqn 1
Where:
The SBE 43 is expected to provide an output voltage that is linear with respect to oxygen concentration. Normal calibration drift manifests itself as a loss of sensitivity and is evident as a change of slope (and less so in offset) in the linear relationship between oxygen concentration and voltage output. The coefficients A, B, C, and E correct for small secondary responses to temperature and pressure. Because these coefficients change very slowly over time, the values given on the SBE 43 calibration certificate will be used in this analysis, and we will concern ourselves with estimating changes in the slope (Soc) and offset (Voffset).
Setting dv/dt to zero, we rearrange equation 1 into a linear form and perform a linear regression to obtain a new Soc and Voffset:
Let:
φ = Oxsol (T,S) * (1.0 + A*T + B*T2 + C*T3) * e (E*P/K) Eqn 2
The oxygen equation then reduces to the form in equation 3:
Oxygen (ml/l) = Soc * (V + Voffset) * φ Eqn 3
This may be expressed in a linear form in equation 4.
Oxygen (ml/l) / φ = Soc * (V + Voffset) = M * V + B Eqn 4
Where:
A linear regression is calculated using Winkler oxygen concentration divided by f as the dependent variable and SBE 43 output voltage as the independent variable.
Example
The example plot below shows Winkler oxygen divided by φ versus SBE 43 output voltage and includes a linear regression line calculated from the data.
Figure 2. Winkler oxygen / phi
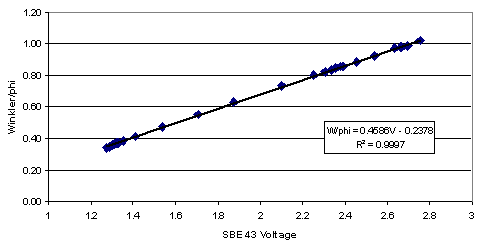
In this example, the new Soc value is 0.4586. The new Voffset value is:
Voffset = (-0.2378 / Soc) = (-0.2378 / 0.4586) = -0.5185
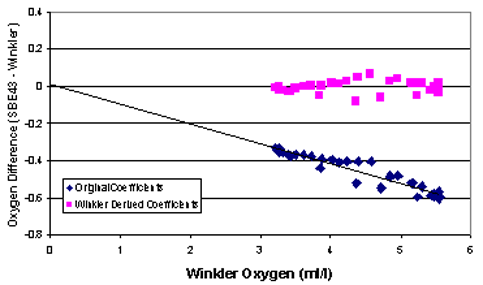
The next plot summarizes the results of the calibration. The diamonds are differences between the SBE 43 dissolved oxygen and Winkler titration dissolved oxygen, using the original calibration. The squares are differences between SBE 43 dissolved oxygen and Winkler titration dissolved oxygen, using Soc and Voffset derived above.
Figure 3. Calibration results
Processing Procedure Using SBE Data Processing
The linear regression that yields a new Soc and Voffset may be accomplished with spreadsheet software, a hand-held calculator with statistical capability, or (with perseverance) a calculator, graph paper, and pencil. As a first step, extract pressure, temperature, salinity, oxygen saturation, and SBE 43 voltage from the parts of your CTD data collected when the water sampler closures occurred.
Run SBE Data Processing, and select Data Conversion in the Run menu. Select the appropriate configuration (.con or .xmlcon) and data (.dat or .hex) files on the File Setup tab. Click the Data Setup tab and set Convert data from to Upcast and downcast and Create file types to Create bottle (.ros) file only.
To extract CTD data concurrent to the water sampler closures, Data Conversion must know when the closures occurred. Select an appropriate Source of scan range data, depending on your instrument type and how the sampler was commanded to close bottles:
Like all sensors, the SBE 43 has a finite response time to a change in dissolved oxygen concentration. This response time is usually on the order of 6 seconds. For this reason, good sampling procedure dictates that the instrument package should be stopped in the water column long enough for the SBE 43 and all other sensors to completely equilibrate before closing the water sampler. An equilibration time of 5 to 6 response times, or 30 to 36 seconds, is adequate.
In the example above, Data Conversion will begin extracting data 5 seconds before each water sampler closure (Scan range offset = - 5 s) and will extract a total of 10 seconds of data (Scan range duration = 10 s). Note that 10 seconds is longer than the SBE 43 response time. Because we are extracting data for 5 seconds after the water sampler closure, the instrument package must remain stopped for at least this long.
To estimate Soc and Voffset, you need pressure, temperature, salinity, oxygen saturation (ml/l), and SBE 43 Oxygen Voltage to go with each Winkler titration data value. Click Select Output Variables and add each of the required parameters; the dialog box is shown below.
After selecting all the variables, click OK to return to the Data Conversion Data Setup tab. Then click Start Process to create the .ros file.
For this example, the .ros file contains 10 seconds of data centered on the moment the bottle closure occurred for every bottle closure. To make a useful table, select Rosette Summary from SBE Data Processing’s Run menu. Rosette Summary calculates averages and standard deviations for the variables selected in Data Conversion. Select the appropriate configuration (.con or .xmlcon) and .ros files on the File Setup tab. Click the Data Setup tab and then click the Select Averaged Variables button; the dialog box is shown below.
After selecting all the variables, click OK to return to the Rosette Summary Data Setup tab. Then click Start Process to create a data table file with the .btl extension.
Create
a table with average pressure, temperature, salinity, oxygen saturation, and SBE
43 output voltage for each water sampler closure depth, by importing the .btl
file into a spreadsheet. Then, enter by hand the Winkler titration dissolved
oxygen values from your titration log, matching water sampler closures to
pressures. Calculate
φ = Oxsol (T,S) * (1.0 + A*T + B*T2 + C*T3) * e
(E*P/K)
using A, B, C, and E from the SBE 43 calibration sheet. Then, calculate
Winkler O2 / φ.
An example table is shown below (using
A = -0.00034959, B = 0.00013078, C = -0.0000027243, and E = 0.0.036),
with
φ (phi)
in column 7 and Winkler O2 / φ
(Winkler/phi) in column 8.
Table 1. Example calculation of phi and Winkler/phi.
|
Pressure (db) |
Temperature (Deg C) |
Salinity | Oxygen Solubility (ml/l) | SBE 43 Output Voltage | Winkler Oxygen (ml/l) | phi | Winkler/phi |
|
194.6 |
15.43 |
35.617 |
5.623 |
2.452 |
5.172 |
5.852 |
0.884 |
|
169.5 |
16.26 |
35.713 |
5.529 |
2.540 |
5.306 |
5.744 |
0.924 |
|
143.7 |
17.17 |
35.793 |
5.430 |
2.635 |
5.488 |
5.632 |
0.974 |
|
93.9 |
18.97 |
35.881 |
5.247 |
2.753 |
5.545 |
5.424 |
1.022 |
|
48.7 |
23.38 |
36.087 |
4.841 |
2.697 |
4.966 |
5.009 |
0.992 |
|
24.0 |
23.94 |
35.840 |
4.801 |
2.664 |
4.852 |
4.956 |
0.979 |
|
9.6 |
23.95 |
35.839 |
4.800 |
2.667 |
4.851 |
4.946 |
0.981 |
Perform a linear regression, with:
If a spreadsheet or statistical calculator is not available, the regression equations are:
M = [ n * Σ ( V * Winkler O2 / φ ) - Σ V * Σ ( Winkler O2 / φ ) ] / [ n * Σ V 2 - ( Σ V ) 2 ]
B = [ Σ ( Winkler O2 / φ ) - M * Σ V ] / n
Where:
n = number of data pairs
M = Slope
B = Offset
And:
Soc = M
Voffset = B / M
SBE 43 Calibration Adjustment or Data Correction for Long-Term Deployments using Sparse Reference Values
The following methods are used to correct fouled SBE 43 sensor data collected primarily in moored applications. They can be applied to oxygen data when only sparse reference samples are available to verify sensor calibration. The methods should be applied only to individual sensors (i.e., a correction calculated for one sensor cannot be applied to other sensors on the mooring). Once a sensor on a mooring is serviced (cleaned) or swapped out, the process should be repeated. Specific applications for moored oxygen sensors include:
Data correction when periodic reference check values are collected while the sensor continues sampling in situ (but no sensor maintenance is conducted) ‑ This data correction is particularly useful for assessing when sensors need to be serviced for real-time data collection programs. It is also applicable for post-processing of data in non-real-time applications. See Example of In Situ Data Correction for Continuous Real-Time Mooring Data Applications below.
Data correction when only pre- and post-deployment reference samples or factory calibrations are available – This data correction requires that no sensor maintenance, such as cleaning, be performed between the pre-and post-deployment reference samples or factory calibrations. See Example of Post-Processing Data Collection below.
Basic Principal
The SBE 43 sensor output is linear with respect to oxygen concentration and maintains a relatively stable output at zero oxygen. Electrochemical drift, a limitation in previous Clark designs, exists somewhere below the calibration uncertainty of 1 µmol/kg and has not been observed in several years of factory calibration data nor in long-deployments on Argo floats and moorings. Therefore, any sensor drift with time is attributed to fouling of the membrane, either biological or waterborne contaminants (i.e., oil). The main term of interest for correcting fouling drift is the SOC term in the SBE 43 sensor calibration equation, as shown here again in Equation 3:
Oxygen (ml/l) = Soc * (V + Voffset) * φ Eqn 3
Where:
φ (defined in Equation 2 earlier in this document) includes terms that correct for the effects of temperature and pressure, and also includes oxygen solubility dependence on temperature and salinity. Because these terms remain essentially constant with fouling and sensor age, we will not concern ourselves with φ for this application. Furthermore, an insufficient number of water samples makes estimation of Voffset uncertain, therefore, we will restrict the correction derived here to the SOC term, which is the calibration term affected most by the fouling.
The loss of sensitivity attributed to fouling of the sensor membrane is observed as a linear change in the sensor output when compared to a set of reference samples (Figure 7 and Table 2). The ratio of the reference sample values to the SBE 43 measured DO concentrations remains constant over the range of the sensor (for multiple values of DO). This allows for the adjustment in the slope term SOC using just one quality reference sample, because any of the reference values would provide the same correction in an otherwise healthy sensor.
Figure 7. Original factory calibration of SBE 43 sensor SN 1114 (green dots); post-recovery calibration prior to sensor cleaning (blue triangles); re-calibration after sensor cleaning (red squares). Notice the loss of sensitivity in the post-recovery calibration (blue triangles) is strictly linear.
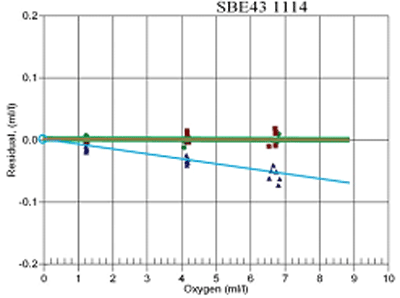
Table 2. Reference Winkler water samples and sensor readings at 3 dissolved oxygen concentrations during post-recovery calibration of SBE 43 sensor SN 1114 (Figure 7). The ratio between the Winkler values and corresponding SBE 43 output can be used to calculate the SOC correction factor. Note the SOC correction factor remains constant at each validation point over the range of oxygen values shown, illustrating that any single validation point alone could be used to correct the slope.
|
Winkler DO of Bath, ml/l |
SBE 43 Output, ml/l |
Residual (SBE 43 – Winkler) |
Correction factor (Winkler/SBE 43) |
| 6.80 | 6.75 | -0.05 | 6.80 / 6.75 = 1.007 |
| 4.20 | 4.17 | -0.03 | 4.20 / 4.17 = 1.007 |
| 1.20 | 1.19 | -0.01 | 1.20 / 1.19 =1.007 |
Simply multiplying the pre-deployment SOC value by the correction factor, given by the ratio
(Winkler DO Value / SBE 43 DO Value)
provides a correction to the linear slope term (SOC) in the calibration equation and offers a powerful and scientifically defensible way to make residual corrections to data from unattended long-term deployments.
Example of In Situ Data Correction for Continuous Real-Time Mooring Data Applications
In this example, we use data collected with an SBE 43 dissolved oxygen sensor deployed in an urban marina for 4 months during the biologically active spring and summer seasons. The integrated SBE 43 and CTD (conductivity, temperature, and depth sensor) was moored at 2 meters water depth and sampled every 10 minutes following a 30-second flush cycle. Replicate Winkler samples were collected bi-weekly from a 1.2-liter Niskin bottle adjacent to the moored SBE 43 sensor at the time of a sample. The SBE 43 measured dissolved oxygen within 5% of Winkler reference values for over 107 days (~3 months) during high biological fouling conditions (Figure 8).
Figure 8. SBE 43 dissolved oxygen time series plotted in dark blue, March 23 – July 31, 2007. Data with a slope adjustment made after May 13 are co-plotted in cyan. Average Winkler values are shown as open pink circles, and the percent difference between the SBE 43 and Winkler averages are co-plotted along the right y-axis as black solid squares (before the May 13 validation and slope adjustment), and as red open squares (from May 13 forward following the adjustment). The dashed curved lines are drawn to illustrate how correcting the in situ data can prolong deployment while maintaining accuracy in real-time (or post-processed) data. Mean standard deviation of the Winkler replicates is 0.03 ml/l.
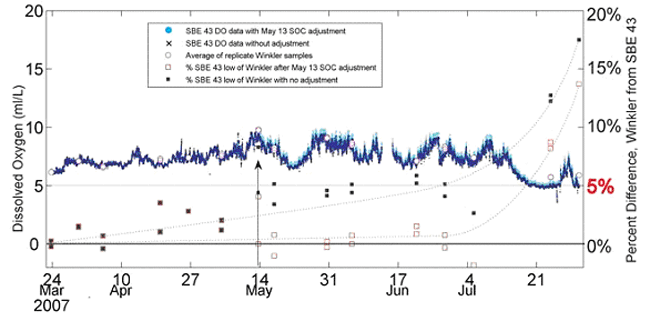
A single validation point made on May 13 is used to demonstrate the correction of in situ sensor data without servicing or recovering the instrument (see arrow in Figure 8). The average of the replicate Winkler values on May 13 is 9.737 ml/l, and the SBE 43 reported 9.308 ml/l. To adjust the calibration for data after May 13, a new SOC value is obtained by multiplying the pre-May 13 SOC value (1.3256e-04) by the ratio of the reference value to the sensor value. Verify the units of each are compatible (ml/l, mg/l, µmol/kg, or % saturation).
[(Winkler value ml/l) / (SBE 43 value ml/l)] => (9.737/9.308 = 1.046):
NewSOC = previousSOC * ([Winkler] / [SBE 43])
1.3866e-04 = 1.3256e-04 *1.046
The result of using the NewSOC on data collected after May 13 demonstrates how sensor accuracy is maintained near initial calibration accuracy by using a single quality reference sample (Figure 8). See the next example for a description of how to apply a correction to data preceding the May 13 reference sample.
Note: We recommend that the sensor be returned to the factory for servicing when the NewSOC value represents a change of 15 - 20% from the original calibration and cannot be restored with standard cleaning protocols (see Application Note 64 for cleaning recommendations).
Example of Post-Processing Data Correction
Sometimes, in-field validation is not possible. This restricts correction of possibly fouled data to post-processing, and requires a reference validation sample be taken at the end of the deployment or soon after the instrument is recovered. The reference validation sample could be a water sample taken in the field prior to recovery or a factory calibration.
A simple method for data correction in post-processing is to assume a linear fouling adjustment per day (or week, or month) for the entire period or between field validation data collection periods. The resultant rate of change in the sensor measurement can then be programmed into a simple algorithm to calculate corrected DO data with time.
Post-Processing Correction Example 1:
The fouling drift in sensor data shown in Figure 8 is linear with time. To apply a correction to the data, simply compute the rate of change per day in the Soc value from the beginning of the deployment to May 13, when an in situ reference sample was made (50 days).
SOCrate = (NewSOC – previousSOC) / # of days
0.0012e-04 per day = (1.3866e-04 – 1.3256e-04) / 50
Post-Processing Correction Example 2:
For this example, pre- and post-calibration data from sensor 1114 are used (Table 2). Sensor 1114 was deployed in a high-fouling coastal lagoon for 2 months with no interim servicing. After recovery, the sensor was returned to the factory for calibration and shown to have fouled ~1% (Table 2). The post-calibration SOC value prior to any cleaning, and the rate of change in SOC, are computed as follows:
NewSOC = previousSOC * ([Winkler] / [SBE 43])
0.3837 = 0.3810 * 1.007SOCrate = (NewSOC – previousSOC) / # of days
4.445e-05 per day = (0.3837 – 0.3810) / 60
During the 2-month deployment period, the sensor experienced an SOC change rate of about 0.000045/day. In reality, a sensor may not exhibit fouling for several weeks to months (as shown here, fouling was minimal), so the user will need to decide how best to determine the time span and data correction criteria of fouled data. Interim water samples or reference checks (using a CTD) between service intervals can provide valuable information on fouling. Variations on the methods used for post-correcting data are also possible.
Data corrections are only as good as the reference samples used to correct the data. We therefore recommend replicate water sample collection, or validation methods that employ a sensor that is as accurate as the moored sensor being tested.
References
Owens, W. B., and R. C. Millard Jr., 1985: A new algorithm for CTD oxygen calibration. J. Physical Oceanography., 15, 621-631.
Garcia and Gordon (1992) "Oxygen solubility in seawater: Better fitting equations", Limnology & Oceanography, vol 37(6), p1307-1312.
Application Note 64: SBE 43 Dissolved Oxygen Sensor -- Background Information, Deployment Recommendations, and Cleaning and Storage
Application Note 64-1: Plumbing Installation -- SBE 43 DO Sensor and Pump on a CTD
Application Note 64-3: SBE 43 Dissolved Oxygen Sensor -- Hysteresis Corrections
![]()
Last modified: 05 May 2010
Sea-Bird Home Phone: (+1) 425-643-9866 Fax: (+1) 425-643-9954 E-mail: seabird@seabird.com