![]()
Software brochure in pdf format | Revision History | Manual | Download instructions | Download from FTP site | Software FAQs
| SBE Data Processing© is part of
our Seasoft V2 software suite. SBE Data Processing consists of
modular, menu-driven routines to convert, edit, process, and plot
oceanographic data acquired with Sea-Bird instruments (CTD data as well as
auxiliary sensor data). SBE Data Processing was developed by oceanographers,
for oceanographers, incorporating input from years of collaboration and
consultation with customers around the world and applying fundamental
principles of oceanography to data analysis. Each module was designed to
perform the necessary data manipulation based on our understanding of the
real oceanographic features involved, and with sound physical reasons for
applying specific corrections to individual types of errors. The software is
continuously refined to reflect the latest oceanographic research, as well
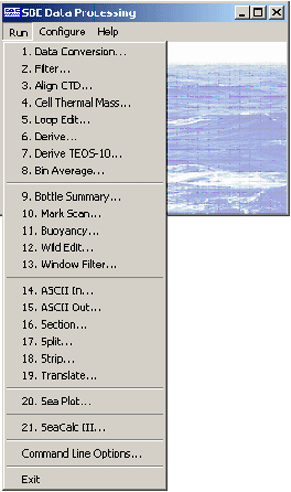
as to incorporate new auxiliary sensors that can interface with our CTDs. Seasoft V2 was designed to work with a PC running Win XP Service pack 2 or later, Windows Vista, or Windows 7. SBE Data Processing modules fall into five categories:
|
 |
1. Raw Data Conversion
Data Conversion performs the first step in data processing, converting the raw CTD and auxiliary sensor data (typically frequencies and voltages) to engineering units. This raw data can be real-time data obtained via Seasave V7, or data uploaded from the CTD memory via Seaterm or SeatermAF. Data Conversion uses the instrument configuration file (same as used by Seasave V7), which defines sensors, sensor channels, and calibration coefficients, to convert the raw data to engineering units.
Data Conversion also outputs separately blocks of data associated with water bottle closures, for easy comparison with lab tests you perform on the collected water samples.
2. Data Processing
Many oceanographic data parameters (e.g., salinity, density, sound velocity) are calculated from a set of temperature, pressure, and conductivity measurements. The highest accuracy in the derived parameters is obtained when the measurements of temperature, pressure, and conductivity are made on the same parcel of seawater. There are two characteristics of every CTD (Sea-Birdís as well as any other manufacturer) that must be overcome to get the highest accuracy:
Evidence of the mismatch of temperature and conductivity measurements is seen in salinity spikes and density inversions in the processed data.
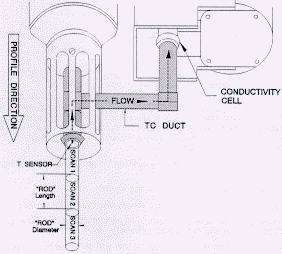
| You can low-pass-filter temperature and conductivity to make their time constants match and you can advance the conductivity data to account for the fact that for a given parcel of water the temperature is measured before the conductivity, if you collect your data as a time series of equally spaced measurements. How can you ensure your data is a time series of equally spaced measurements? To ensure that the temperature and conductivity measurements are made on a constrained water sample, we plumb them together with a T-C Duct; the T-C pair has water drawn through them with a pump that moves water at a consistent, known speed. One way to visualize this is as a rod of water that moves into the duct and flows past the thermometer and into the conductivity cell. Because the water sample is pumped through the duct and conductivity cell, it is not subject to accelerations (sloshing) due to ship heave. Controlling the flow rate of sample water past the sensors assures that the time constants and measurement timing is constant. Filtering and aligning the date is particularly successful for Sea-Bird instruments, because of this technique of constraining the sample as it is measured. |
 |
SBE Data Processing includes two modules to ensure that subsequent derived parameters are calculated based on matching temperature and conductivity:
Conductivity is a function of temperature. The conductivity cell is constructed of glass and plastic, and as such has a thermal mass. When the cell goes from warm water into cold, the water that passes through the cell is warmed slightly as it passes through the cell. Conversely, when the cell goes from cold water into warm, the water that passes through the cell is cooled slightly. This causes the water in the cell to be a different temperature than the thermometer measured before the water reached the conductivity cell. This heat transfer can be modeled and corrected by running Cell Thermal Mass.
In the real world, errors that are completely unrelated to
the CTD often creep into the data:
|
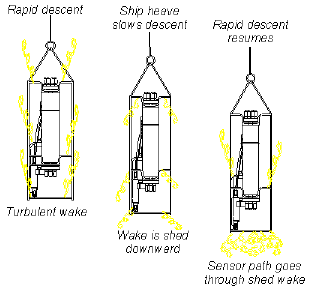 |
SBE Data Processing includes two modules to deal with marking data associated with ship heave and other real world deployment problems:
After the corrections have been made to account for the real-world deployment of the CTD, you are ready to calculate parameters derived from the basic measurements of the CTD and auxiliary sensors. Derive uses the pressure, temperature, conductivity, and auxiliary sensor data to calculate a large number of parameters, using EOS-80 (Practical Salinity) equations, including:
A new module, Derive TEOS-10, was introduced in 2013. Derive TEOS-10 uses temperature, conductivity or salinity (Practical, EOS-80), pressure, latitude, and longitude to compute the following thermodynamic parameters using TEOS-10 equations:
Often, the last step in processing data is to average the data, to reduce the data set to a usable size. Bin Average makes a statistical estimate of data values at user-defined intervals based on pressure range, depth range, scan number range, or time range.
SBE Data Processing includes a few more data processing modules for specialized applications:
3. File Manipulation
File manipulation modules can be used to add descriptive information to a file or easily extract the desired information from the data:
4. Data Plotting
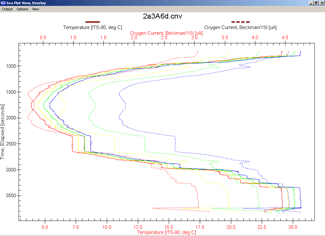
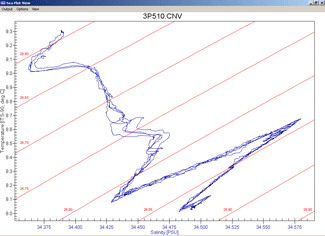
SeaPlot plots up to 5 variables, with 1 X axis and up to 4 Y axes or 1 Y axis and up to 4 X axes, using linear and/or logarithmic scales. It can create contour plots, generating density or thermosteric anomaly contours on temperature-salinity (TS) plots. Overlay plots allow the user to view multiple data sets at the same time; each file can be offset to create a waterfall plot. Plots can be sent to a printer, saved to the clipboard for insertion in another program (such as Microsoft Word), or saved as graphic files in bitmap, metafile, or JPEG format.
| 5. Sea Water Calculator SeaCalc III is a seawater calculator that calculates derived variables (salinity, depth, density, etc.) from one user-input scan of temperature, pressure, etc. SeaCalc III allows you to calculate variables based on EOS-80 (Practical Salinity) or TEOS-10 (Absolute Salinity). SeaCalc III can be used as a quick check on the expected range of derived data, as well as evaluation of the sensitivity of the derived parameters to small changes in the basic measurements.
|
![]()